Some parts of this site, such as the product listings and video players, need JavaScript to display.
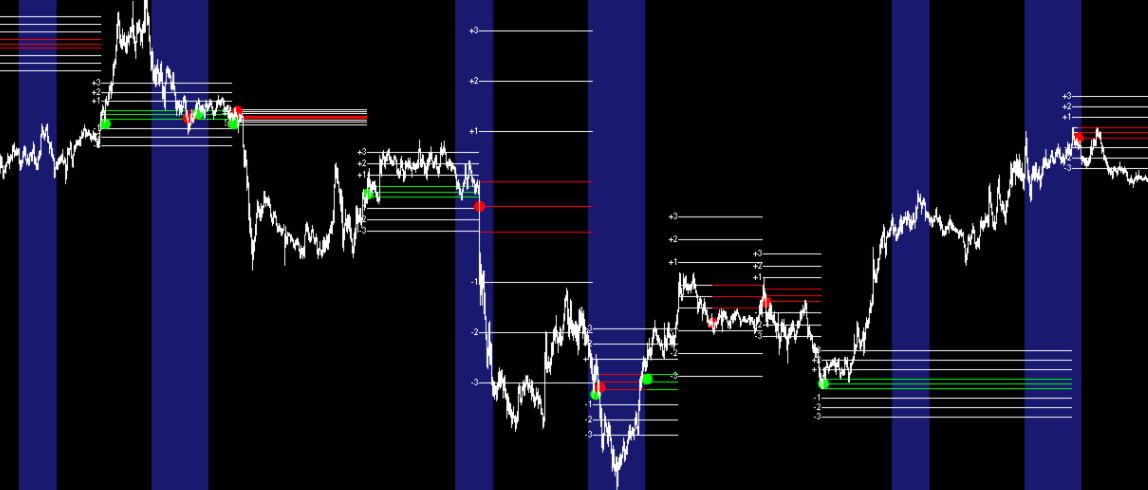
Market analysis tools for MetaTrader 5, drawn as clear, readable visuals directly on the chart.